Most traders run their day across five or six tabs: a charting site, a screener, a news feed, a spreadsheet for position sizes and a journal. A trading dashboard puts that workflow on one screen. The good ones go further and tell you something you couldn't easily work out yourself.
MAC Terminal (Market Action Center) is a web-based trading workflow dashboard for swing traders: it reads the market from index structure and breadth, measures hot themes against SPY, and sizes trades from your own levels. Disclosure: TechVerdict's owner also builds MAC Terminal. Nothing in this article is investment advice.
This article covers what a swing-trading dashboard should handle, the tools MAC Terminal has for each job, and the part that's unusual: a research engine, which MAC Terminal calls the Brain, that turns well-known traders' published rules into exact algorithms and tests them before showing them to anyone.
The Short Version
A good dashboard covers six jobs: read the market, find where money is moving, plan the trade, size it, stop yourself on bad days, and review what happened.
MAC Terminal has a tool for each, from a one-word market read to a P&L journal, for $10 a month after a free 7-day trial.
What's different: its Brain encodes setups from traders like Qullamaggie as exact rules, replays them on years of data, paper-trades them forward every night and compares every trade with 20 random stocks. Nothing reaches users until a setup holds up on data it has never seen.
What a Trading Dashboard Should Do
Charting platforms are built for charts and screeners for filters. A dashboard is built around a trading day. For a swing trader, that day has six jobs:
| Job | What a dashboard should do | MAC Terminal's tool |
|---|---|---|
| Read the market | Say whether conditions favor buying, at a glance | One-word market read from large and small caps against their 50-day averages, plus breadth |
| Find where money is moving | Rank sectors and themes by strength | Hot themes against SPY over 10 sessions and the last 3, with each name's ADR and distance from its 20-day high |
| Plan the trade | Turn a setup into an entry and a stop | Opening-range plan: entry above the first 5-minute high, stop at the day's low |
| Size it | Calculate shares from your risk | Shares sized from the stop, inside your account size, risk per trade and position-size cap |
| Stop the bleeding | Enforce limits on bad days | Daily and weekly loss limits |
| Review | Show what's working | Journal with P&L by day, week and month; Thinkorswim CSV import or manual entry |
MAC Terminal's Tools
A market read in one word
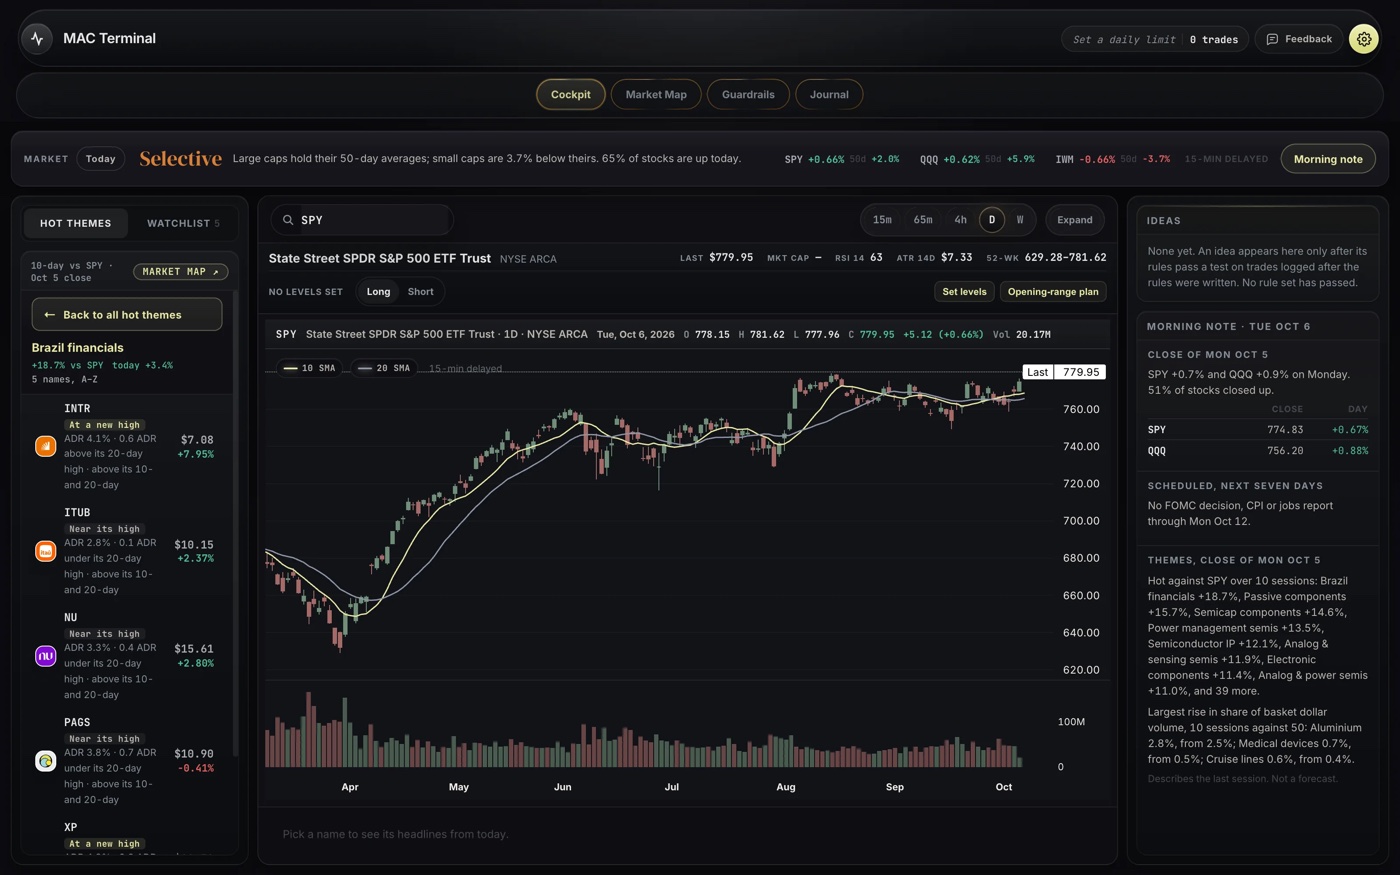
The cockpit opens with a single word for the day's conditions. It's based on where large caps and small caps sit relative to their 50-day moving averages, plus breadth: how many stocks are actually rising. On the day in the screenshot it reads "Selective": large caps above their 50-day averages, small caps 3.7% below theirs, 65% of stocks up. It's a quick check before you look at a single chart.
Hot themes measured against SPY
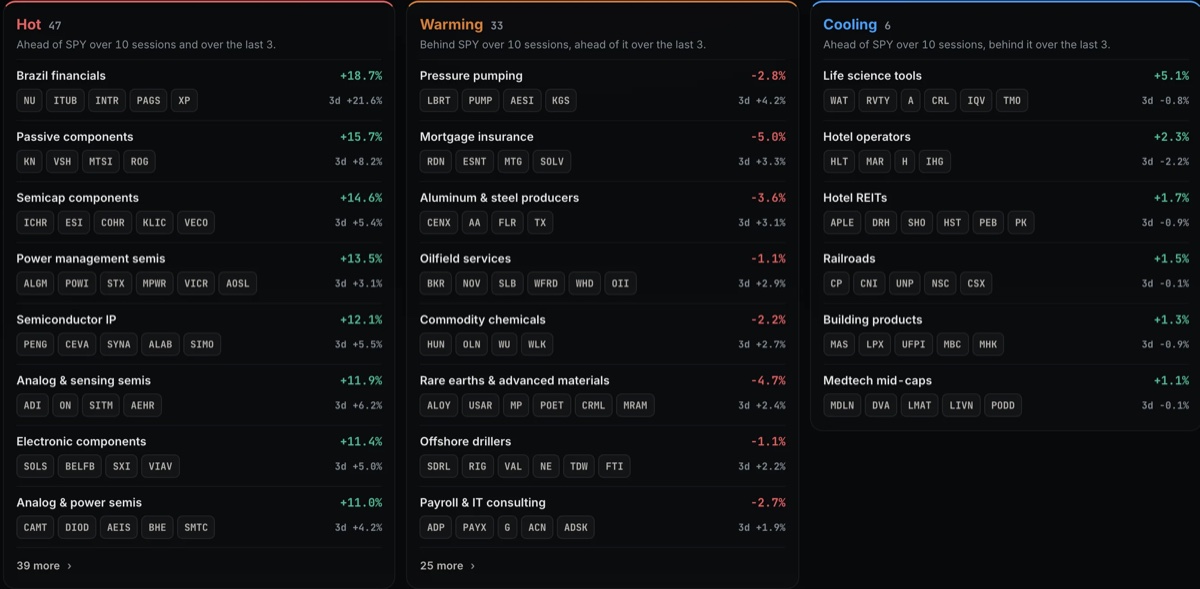
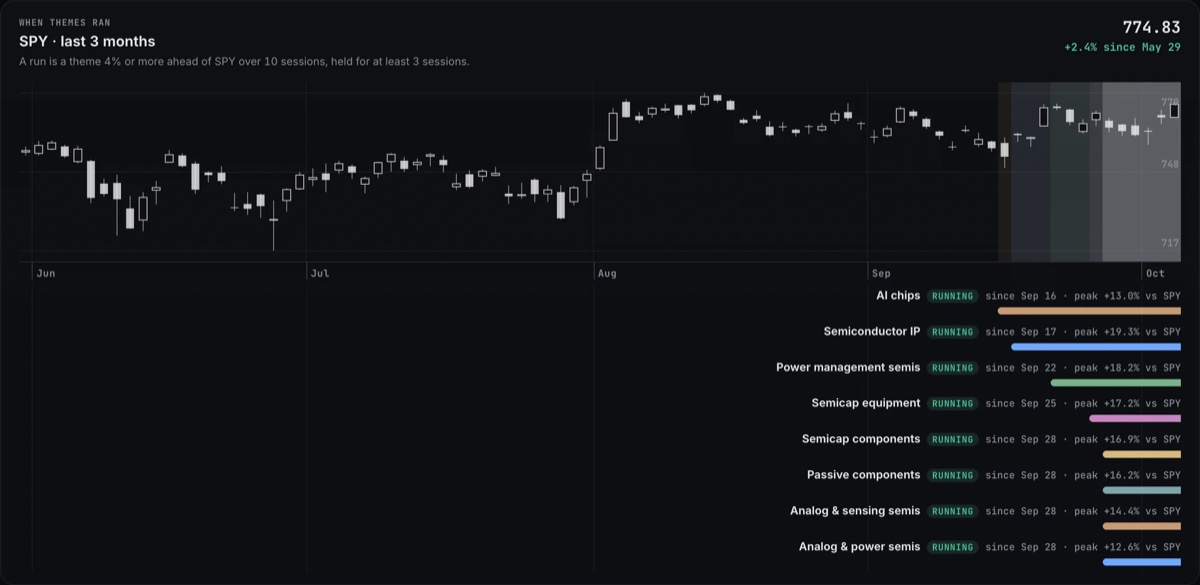
Instead of standard sectors, MAC Terminal groups stocks into narrower themes, like semicap components or power management semis, and ranks them by performance against SPY over 10 sessions and over the last 3. Themes are sorted into hot, warming and cooling. For each stock inside a theme it shows the average daily range (ADR) and how far it sits from its 20-day high, which is what a swing trader checks first.
Trade plans and position sizing
For entries at the open, MAC Terminal builds an opening-range breakout plan: an entry above the first 5-minute high, a stop at the day's low, and a share count sized from that stop. You set your own levels for other trades. Guardrails sit around every plan: your account size, risk per trade, a position-size cap, and daily and weekly loss limits.
A journal and a morning note
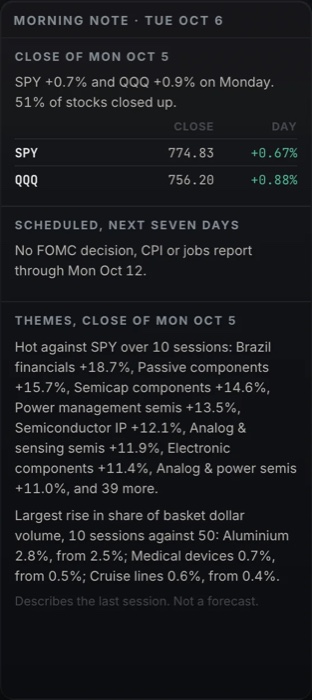
The journal tracks P&L by day, week and month, from a Thinkorswim CSV import or manual entry. A morning note arrives by email before the open with the previous close, the week's scheduled reports and the themes that moved.
What Makes It Different: The Brain
Many tools offer strategies or signals. Few show whether those strategies still work, and fewer still hold one back until it does. That's the job of MAC Terminal's Brain.
It turns well-known traders' rules into exact algorithms
Many successful traders have published how they trade. The Brain encodes those rules precisely enough for a computer to run them. On day one it runs five rule sets, including two built from the publicly shared rules of Kristjan Kullamägi (Qullamaggie): his momentum breakout and his episodic pivot, a gap of 10% or more with heavy volume in the first five minutes. Setups from Lance Breitstein are planned next. Every rule is written down and hashed before testing begins, so it can't be quietly adjusted after the results come in.
It tests them against random stocks
A setup that made money in a rising market might have made money buying anything. So every trade the Brain takes is paired with 20 random stocks from the same pool, bought the same day with the same stop and exit. A setup only counts if it beats its random partners consistently, not just in absolute terms.
It learns from history, then proves it forward
The Brain works in two stages. First, a research lab replays setups across five years of daily bars on thousands of US stocks, along with earnings dates from SEC filings for 2,789 companies. Then setups run forward every night in a pre-registered learning log, which started trading on October 5, 2026. New setups reach the log only by passing the lab's gate. It paper-trades each setup on a $50,000 account, risking 1% per trade, and tags each trade with the hot theme it belongs to. The first monthly review is October 30.
The lab also lets Claude propose new rules, which face exactly the same test.
It doesn't show you anything until it's proven
This is the unusual part. Nothing from the Brain reaches the app, the morning note or any public page until a setup proves itself on data it never saw. The Ideas panel in the cockpit says it plainly: "None yet." That's a deliberate choice: an empty panel is more honest than a list of signals that haven't been tested.
What MAC Terminal Isn't
- Not a broker. It's analysis software. You place trades at your own broker.
- Not real-time. Market data is delayed 15 minutes, which suits swing trading more than scalping.
- Not an auto-trader. It plans and sizes trades. It doesn't place them for you.
- Not a replacement for a charting platform. Dedicated charting tools still go deeper on indicators and drawing. MAC Terminal is built around the daily workflow.
Who It's For
MAC Terminal fits swing traders who trade US stocks, follow momentum and themes, and want their sizing and loss limits enforced rather than remembered. It's less useful for day traders who need real-time data, or for long-term investors who check the market weekly. It costs $10 a month after a free 7-day trial, with no card required to start.
FAQ
What is MAC Terminal?
MAC Terminal is a web-based trading workflow dashboard for swing traders. It reads the market from index structure and breadth, measures hot themes against SPY, and sizes trades from your own levels.
How much does it cost?
There's a free 7-day trial with no card required. After that it's $10 a month.
Is it a broker?
No. MAC Terminal is analysis software, and you place trades at your own broker.
How fresh is its data?
Market data in MAC Terminal is delayed 15 minutes.